
Tools & Templates / Data & Decision-Making
Data & Decision-Making Tools
Reusable systems for comparing options, prioritizing needs, documenting evidence, and making assumptions visible instead of burying them inside a score.
College + Career Explorer · National College Search
An interactive application of transparent, source-linked decision support. Compare U.S. colleges by available institutional characteristics, costs, average net prices, and admissions measures. The student-facing introduction is in Career & Professional Development Tools.
Data scope: Public institution-level records; missing values are identified rather than assumed. Specific programs, credentials, and career pathways are not yet verified in this view.
Decision, Prioritization & Needs-Assessment System
A flexible workbook for project prioritization, needs assessment, program comparison, vendor review, resource allocation, portfolio choices, and other decisions where several factors matter at once.
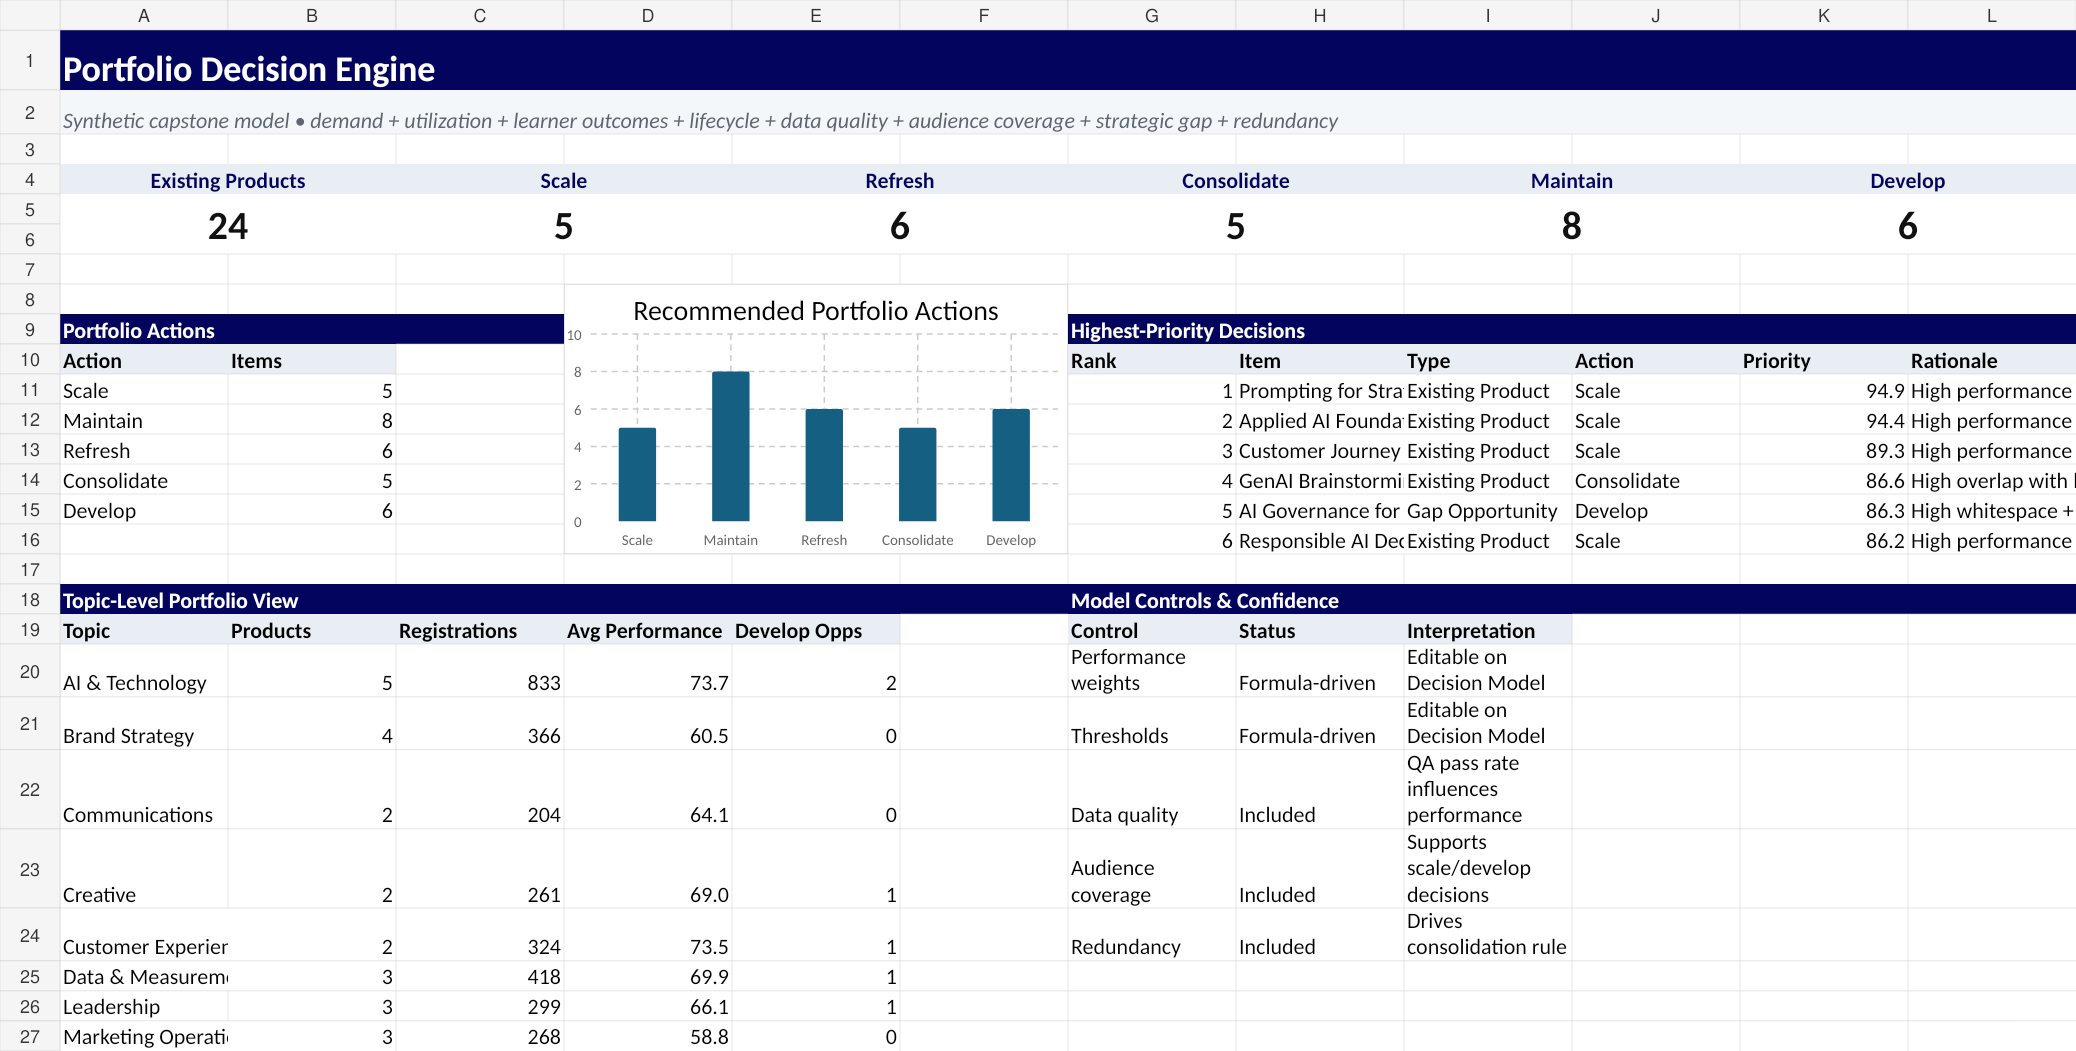
Up to 10 criteria, explicit weights, scoring guidance, and 100% weight QA.
Higher-is-better, lower-is-better, and judgment-based scoring modes.
Non-negotiable thresholds remain visible instead of being diluted by a high total score.
Every assessment can carry a rationale, source, and 1–5 confidence value.
Base case plus three alternative weight models to test different strategic priorities.
Criterion-by-criterion stress testing shows whether an option is robust or highly assumption-sensitive.
What the model does—and does not do
The system automates normalization, weighting, coverage checks, scenario comparison, and sensitivity analysis. It does not treat the highest score as an unquestionable answer. Gate failures, evidence confidence, missing assessments, and sensitivity remain visible so the reasoning can be challenged and updated.
Survey / Needs-Assessment Builder & Analysis Workbook
A reusable workbook for designing a short survey, documenting fielding decisions, pasting response data, applying transparent QA rules, summarizing scored items, comparing segments, prioritizing gaps, coding open text, and drafting qualified findings.
Flags missing metadata, long wording, possible double-barreled phrasing, and absolute wording for review.
Consent, completion-time, attention-check, straightlining, and missing-item rules remain visible and auditable.
Included N, mean, favorable rate, missingness, and low-sample flags for up to 12 scored items.
Compare user-defined groups against the included-response overall mean with low-N warnings.
Importance minus current-state gap, weighted priority score, evidence, confidence, and priority band.
Open-text coding, sentiment, counterexamples, findings prompts, and explicit limits on what the data establishes.
Method boundary
The workbook separates descriptive survey results from interpretation. Response patterns, subgroup differences, and gap scores are evidence to assess—not automatic causal claims or proof that results generalize to nonrespondents.
Related: Project & operations tools · Research & writing tools · Analytics and decision-support case studies