
Survey Research & Learning Transfer Analysis
Research operations · survey design · reliability · cross-tabs · regression
A fully synthetic end-to-end survey research project examining the conditions associated with learning transfer after professional training. The artifact covers instrument design, sampling and fielding, response-quality rules, scale construction, reliability, cross-tabs, multivariable modeling, data-management considerations, and executive research synthesis.
No real learners, employees, clients, students, or research subjects are represented.
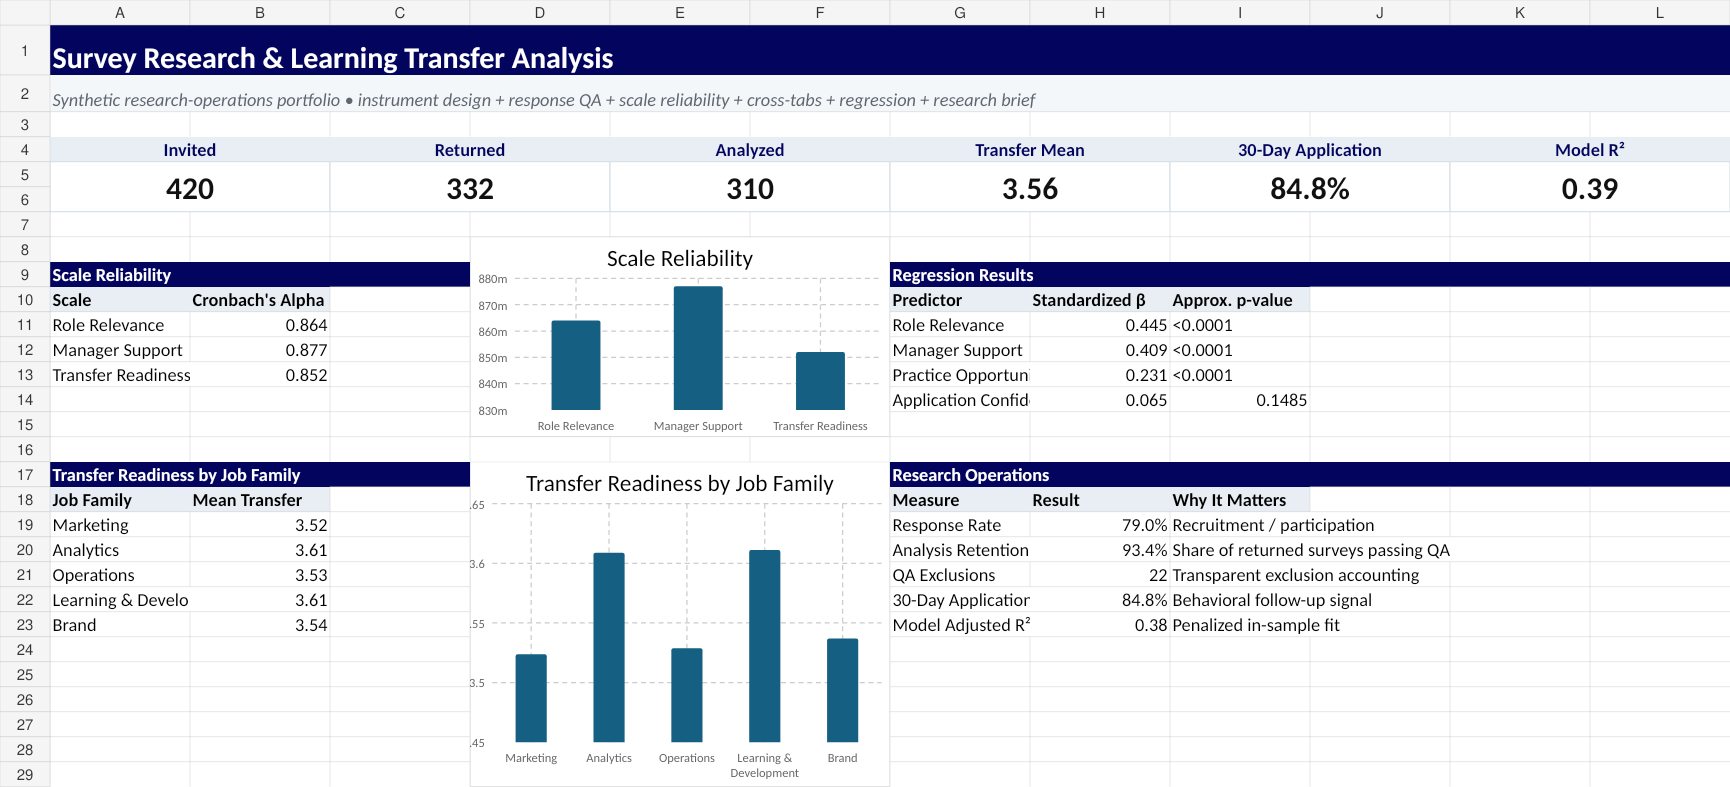
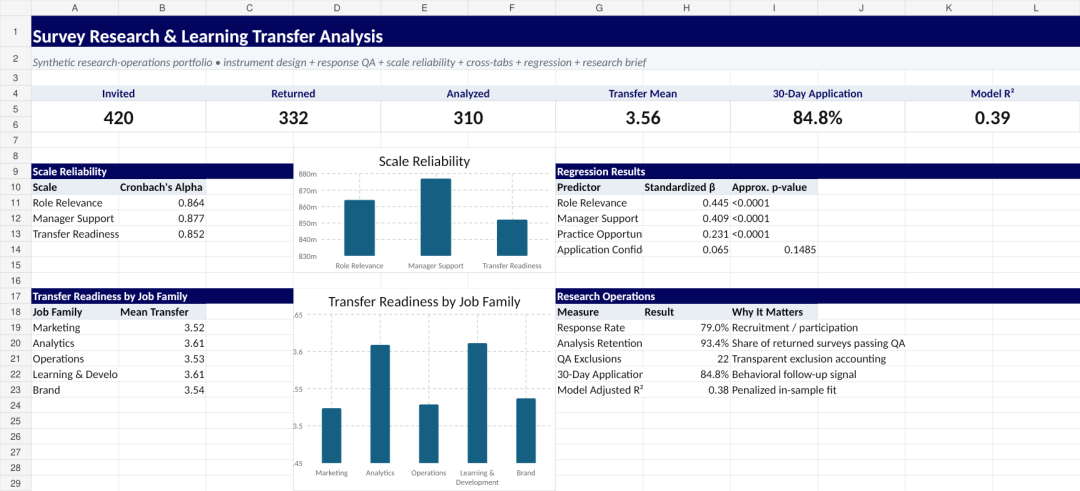
Results at a glance
| Measure | Synthetic result |
|---|---|
| Invited | 420 |
| Returned surveys | 332 |
| Analyzed responses | 310 |
| Response rate | 79.0% |
| Analysis retention | 93.4% |
| Mean transfer-readiness score | 3.56 / 5 |
| 30-day reported application | 84.8% |
| Model R² | 0.387 |
Scale reliability
Role Relevance — α = 0.864
Manager Support — α = 0.877
Transfer Readiness — α = 0.852
Model interpretation
The OLS model predicts synthetic Transfer Readiness from Role Relevance, Manager Support, Practice Opportunity, and Application Confidence. The strongest standardized association is Role Relevance (β = 0.445), followed by Manager Support (β = 0.409) and Practice Opportunity (β = 0.231). Application Confidence is smaller in the adjusted model (β = 0.065; approximate p = 0.1485).
The model explains 38.7% of the variance in Transfer Readiness (adjusted R² = 0.378). Because predictors and outcome are measured in the same synthetic survey, the model is framed as associational, not causal.
Executive communication sample
Drivers of Learning Transfer is a three-page executive research memo translating the synthetic survey analysis into decision-ready prose for a senior stakeholder audience.
The memo moves from research question and evidence to implications, limitations, and a recommended prospective intervention. It highlights the strongest adjusted associations—Role Relevance (β = 0.445), Manager Support (β = 0.409), and Practice Opportunity (β = 0.231)—while explicitly separating association from causal inference.
The writing sample demonstrates: executive synthesis · statistical interpretation · methods communication · limitations framing · research recommendations · visual evidence integration.
Available as polished Word and PDF portfolio samples. All underlying data and findings are synthetic.
What the project demonstrates
- Survey instrument and construct design
- Sampling and fielding plan
- Consent and IRB-style data-management considerations
- Response-quality flags for incomplete responses, speeding, straightlining, and consent
- Codebook and cleaned analytical dataset
- Cronbach’s alpha and scale construction
- Cross-tabs by job family and seniority
- OLS regression and standardized coefficient interpretation
- Executive research synthesis and recommendations
Workbook architecture
12 tabs: Executive Dashboard · Research Brief · Survey Instrument · Sampling & Fielding · Raw Responses · Cleaned Responses · Scale Reliability · Cross-Tabs · Regression Model · Data Management · Codebook · Portfolio Guide.
The workbook retains QA-excluded records and their reasons, separates raw and cleaned data, documents scale definitions, and includes explicit human-subjects/data-governance notes. All results are synthetic.